

Instructions for using the Advanced Optimization Report
Connecting functions for saving balance, equity, and optimization statistics graphs
If you have access to the Expert Advisor code, you can extend the report by adding additional code.
Download the Advanced Optimization Report Saver.mqh file from page https://www.mql5.com/en/code/68706 and save it to the terminal folder \MQL5\Include\ (you can also add new criteria for the report on the same page)
Add the code that connects the downloaded file: (you can add it below the last line of your Expert Advisor code or anywhere else)
| #include <Advanced Optimization Report Saver.mqh> |
Then, you need to add calls to the exported functions to the existing functions in your Expert Advisor: (if there are no functions, add them)
|
void OnTick(){ |
In the highlighted area, you can add your own criteria that you want to include to the Advanced Optimization Report.
For example, let's add this code to the Moving Average Expert Advisor from the Examples folder (...\MQL5\Experts\Examples\Moving Average\Moving Average.mq5). First, copy the original Expert Advisor and name it Moving Average Charts.mq5. Now, add the code from the instructions above to it.
The changes are only at the very end of the code, starting from the OnTick() function:
|
void OnTick(void) #include <Advanced Optimization Report Saver.mqh> |
As you can see, it's quite simple and only takes a couple of minutes.
After that, you can run the optimization:
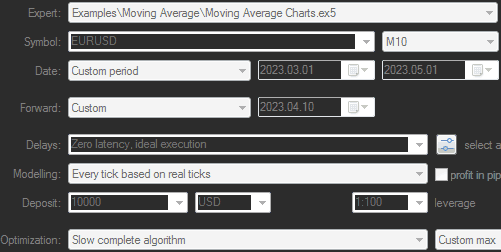
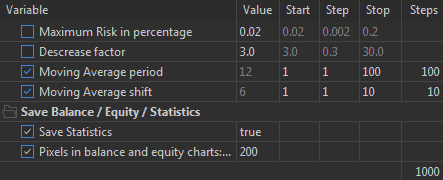
The last screenshot shows that the connected code added 2 parameters:
- Save Statistics - enables or disables the collection of statistics
- Pixels in balance and equity charts - specifies the number of pixels in the width of mini-charts.
Once the optimization is complete, you can create a report and see the following:
|
100 lines with MovingPeriod
|
10 lines with MovingShift
|
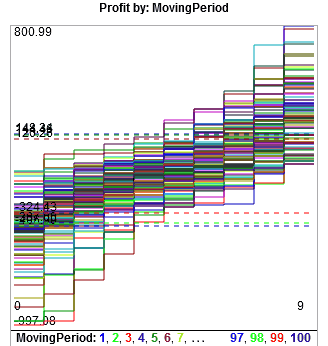
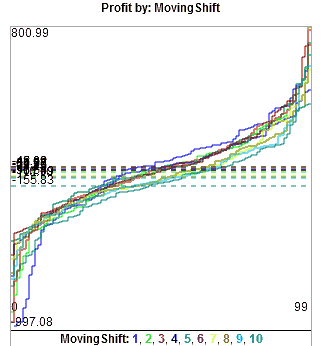
If there are more than 20 lines, only 3 horizontal lines of average values will be displayed: 3 on top and 3 on the bottom.
It is difficult to perceive 100 lines, so you need to use filters. Alternatively, you can resize the chart to 100% of the screen width or click on the chart to open it in Google Charts, which allows you to zoom using the mouse wheel.
It is even better to use input variables not with the same step, but with a scale through an enumerator (enum), for example: 1,2,3,5,7,10,15,20,30,50,70,100 - there will be only 12 lines instead of 100.
|
enum nums1 {__0=0, __1=1, __2=2, __3=3, __5=5, __7=7, __10=10, __15=15, __20=20, __30=30, __50=50, __70=70, __100=100, __150=150, __200=200, __300=300, __500=500}; |
You can download the enum version of the Expert Advisor here.
Instead of 1000 optimization passes, there will be 120, and the calculation time will be ~8 times faster, and the file size will be ~8 times smaller.
The result is more visible:
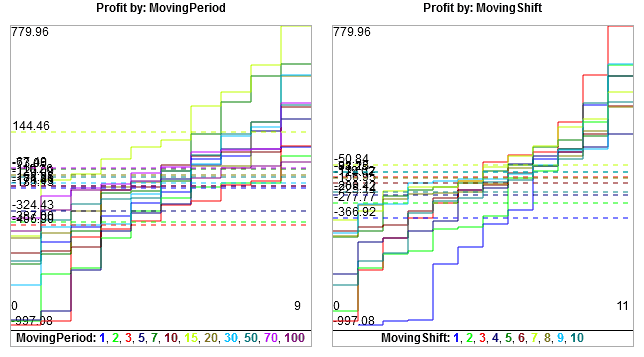
The result with MovingPeriod = 15 stands out immediately, with the highest average line and the highest maximum.
However, as is often the case, the best results on the backtest are not the best on the forward test:
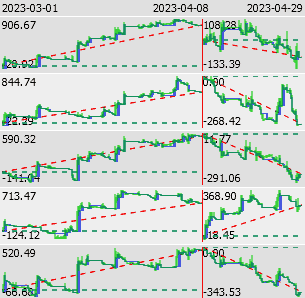
You can open and examine the resulting report:
Connecting code for optimization in mathematical mode
You need to add calculations to your EA code in Virtual.
Limitations in the testing mode for All Symbols
- Collecting statistics and graphs for All symbols does not work due to a bug in the tester, which does not send data frames. The error has been reported to the MT5 developers, and we hope that it will be fixed soon.
- In this mode, it is also not possible to export the .opt file. You must find it yourself in the same location as all other .opt files.
Usually here
© 2025 - 2026